낙동강 중하류에서의 미량오염물질 출현 및 농도
Occurrence and Concentration of Micropollutants in the Middle-and Down-stream of Nakdong River
Article information
Trans Abstract
The Nakdong River runs through highly industrialized and populated areas and has thus been polluted with numerous anthropogenic chemicals. As a growing number of new chemicals have been developed and used, the complexity of pollution in the receiving water has increased. In this study, LC-HRMS-based quantitative analysis was performed on 174 micropollutants in order to understand the status of new trace pollutants occurring in the middle and lower sections of the Nakdong River. In this analysis, 106 substances were detected at concentrations above the LOQ. Benzotriazole, used as a rust inhibitor, showed the highest median concentration, followed by metformin and diethylene glycol dibenzoate, all with maximum concentrations above 1,000 ng/L. Among pharmaceuticals, metformin, valsartanic acid, metoprolol acid, and carbamazepine had high median concentrations. Similarly, high concentrations were observed for metolachlor ESA, 2-aminobenzimidazole, and flubendiamide among pesticides, and benzotriazole, diethylene glycol dibenzoate, and dimethyl phthalate among industrial agents and other substances. The sample collection point with the highest number of substances detected was point N3, which also showed the greatest sum of median concentrations. With respect to substance groups, the highest median concentration levels were found at N2 for pharmaceuticals, N1 for pesticides, and N3 for industrial chemicals. Among the detected trace pollutants, a total of 44 substances were selected as priority substances after considering domestic and international water quality standards, detection concentration and frequency, and toxicity. These substances are suggested for preferential monitoring and management in the middle and lower sections of the Nakdong River.
1. 서 론
인간의 삶의 양태가 더욱 다양해짐에 따라 사용되는 화학물질의 종류 또한 다양해지고 있다. 화학물질의 사용은 필연적으로 환경으로의 배출로 이어지게 되는데, 이는 곧, 환경에 출현하는 오염물질의 종류 또한 다양해지고 있음을 의미한다[1,2]. 이러한 오염물질의 다양성은 생태계의 교란을 가중시키고 이를 관리하는 환경정책 및 계획의 수립을 더욱 복잡하게 만든다. 예를 들어, 수환경 보호를 위한 화학물질 관리 정책에 있어서, EU의 경우, 새롭게 출현하는 신종 오염물질 (emerging substances)의 관리 및 규제를 위해 Watch list 제도를 도입하였다[3-5]. 해당 제도는 수질기준안이 설정되어 있지 않은 신종 오염물질을 대상으로 하며, 이들 중 유럽수계 내 모니터링 정보가 충분치 않아 수질기준안 설정여부가 결정되지 않은 물질을 선정하는 것을 목표로 하고 있다. Watch list에 선정된 10여종의 물질은 수년 간에 걸친 모니터링 정보와 위해성평가 등을 거쳐 수질기준안 설정 여부를 평가받게 된다. 또한, 해당 리스트는 지속적으로 업데이트되는 신종 오염물질 정보를 바탕으로 4년을 주기로 재작성된다. 이러한 체계는 새롭게 출현하는 오염물질의 출현을 빠르게 인지하여 관리부재 및 지연으로 인한 환경 및 인체피해를 최소화 하는데 효과적인 것으로 평가받고 있다. 반면, 국내의 경우, 수질오염물질 지정 등에 관한 제도를 통해 우선 순위물질을 선정, 주기적인 모니터링을 수행하고 있으나, 신종 오염물질 인지 및 확인을 위한 구체적인 방안이 없어, 이들에 대한 관리부재가 우려되는 상황이다.
낙동강은 고도로 산업화되고 인구 밀도가 높은 지역을 관통하고 있다. 중상류에 위치한 구미 (면적: 615.3 km2, 인구: 41만, 산업체: 37,048개소 (2018년 기준))는 국내 최대의 내륙 국가 산업 단지이며, 중류의 대구광역시 (면적: 883.5 km2, 인구: 241만 산업체(제조): 26,961 개소(2018년 기준))는 섬유, 금속, 기계 생산 등 다양한 산업을 수용하는 국내 인구규모 4위 대도시이다. 인구 밀도가 높고 산업화된 이들 지역은 상당한 양의 하폐수를 낙동강으로 방류하고 있어, 최근까지도 화학물질에 의한 오염사례가 종종 보고되고 있다[6-8]. 한편, 대규모 하폐수의 방류는 다양한 신종 오염물질이 낙동강의 중하류에 존재하고 있음을 암시하고 있다. 그럼에도 불구하고, 새롭게 출현하는 미량오염물질에 대한 정보는 매우 제한적이다. 일부 연구에서[7,9–11] 낙동수계 미량 오염물질 관련 연구를 수행하였으나, 강의 규모 및 중요도를 고려하면 정보의 양과 질은 미미한 수준이다. 하류의 경남 및 부산지역에서는 낙동강을 식수 원수로 사용한다는 사실을 상기하면, 낙동강에 출현하는 화학물질의 정보는 보다 개선되고 보완되어야 할 것으로 판단된다. 유럽의 대표하천인 라인강에서는 매일 300 여종의 미량오염물질에 대한 정량분석을 수행하고, 이와 함께 비표적분석 (non-target screening)을 통해 미지의 물질 (unknown substances)에 대한 지속적인 모니터링을 수행하고 있다[12-14]. 라인강 오염물질에 대한 풍부한 정보는 고분해능질량분석기 (High resolution mass spectrometry, HRMS)의 사용을 통해 더욱 증폭 되었다[15–17]. 액체크로마토그래피와 결합된 HRMS (LC- HRMS)는 광범위한 유기오염물질을 검출하는 데에 최적화된 것으로 알려져 있다[18-23]. 특히, ESI (electrospray ionization) 소스를 통한 이온화 방법은 대부분의 수계 미량오염물질을 포함하는 친수성 물질에 대한 높은 이온화 효율을 나타낸다[24].
본 연구에서는 낙동강 중하류에서 출현하는 신종 미량오염물질에 대한 정보를 수집하기 위해, 문헌조사 등을 통한 후보물질을 선정하고, LC-HRMS를 이용하여 정량분석 가능한 물질을 대상으로 모니터링을 수행하였다. 이를 통해 낙동강 중하류에 존재하는 주요 신종 오염물질의 분포와 농도을 확인하고, 국내외 수질기준안 존재여부, 생물 농축성 및 독성정보 등을 토대로 우선관리가 필요한 미량오염물질 목록을 제안하고자 한다. 제안된 목록 정보는 추후 국내 수질모니터링 및 환경기초조사 사업 등에 활용될 수 있을 것으로 기대된다.
2. 재료 및 방법
2.1. 시료채취 지점
시료채취는 2020년 3월과 4월에 대구 합류 전 상류지역에서 창녕 남지 상류지역까지 총 6개 지점 (N1-N6)에서 총 9회 수행되었다 (Fig. 1). 해당 수계는 경북 구미 및 대구광역시에서 발생된 하폐수 방류수의 직접적인 영향을 받고 있는 지역으로, 의약품 및 개인관리용품 뿐만 아니라 산업단지에서 사용되는 다양한 화학물질이 검출되고 있는 것으로 알려져 있다[6,7]. N1 지점은 구미지역의 하류이자 금호강 합류 이전 지점으로 구미 지역에서 발생된 방류수의 영향을 반영하고 있는 것으로 판단된다. N2-N6 지점은 대구의 하류지점이자 금호강, 황강, 및 남강 등 낙동강 중하류의 대표적인 지류들이 합류하는 곳으로, 대구지역과 지류의 의한 오염 및 희석효과 등을 확인할 수 있는 곳으로 판단된다. 특히, N6 지점은 경남지역 주민에게 공급하는 상수의 채수지점으로 다양한 미량오염물질에 대한 정보확보가 필요한 것으로 사료된다. 유리용기에 수집된 강물 시료(1L)는 아이스박스에 담겨 운반되었고, 이후 4oC 냉장고에서 전처리 단계 이전까지 보관되었다.
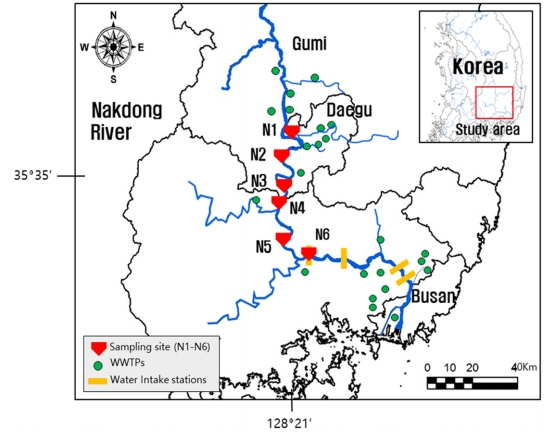
Location of sampling sites in Nakdong River basin.
2.2. 분석 대상물질의 선정 및 표준시약
분석 대상물질 선정을 위해 구글 scholar 검색엔진을 이용하여 최근 5년간의 문헌조사를 수행, 주요 미량오염물질에 대한 정보를 확보하였으며, 이와 동시에 국내 연구보고서 및 논문을 검색하여 낙동강 수계에서 검출된 화학물질에 대한 정보를 수집하였다. 이를 통해, 출현 가능한 미량오염물질로, 약 595종의 후보물질 리스트를 작성하였으며, 이중 LC 장비를 활용해 분석 가능한 174종을 최종 표적대상물질로 선정하였다 (Table 1). 대상 물질은 의약품 72종, 농약 58종, 산업용제 및 기타 44종으로 구분되었다. 표준물질은 순도 99% 이상을 구입(Sigma-Aldrich, USA, Toronto Research Chemicals, Canada)하여 사용하였다. 에탄올에 용해된 표준용액(1,000 mg/L)은 분석 실행 전에 −20oC 어두운 곳에서 보관하였다. 분석 절차에 사용된 화학 물질 및 용매는 순도 99% 이상 (HPLC 등급)을 구입하여 사용하였으며, 이들 분석대상물질에 대한 자세한 정보는 Table 1에 나타내었다.
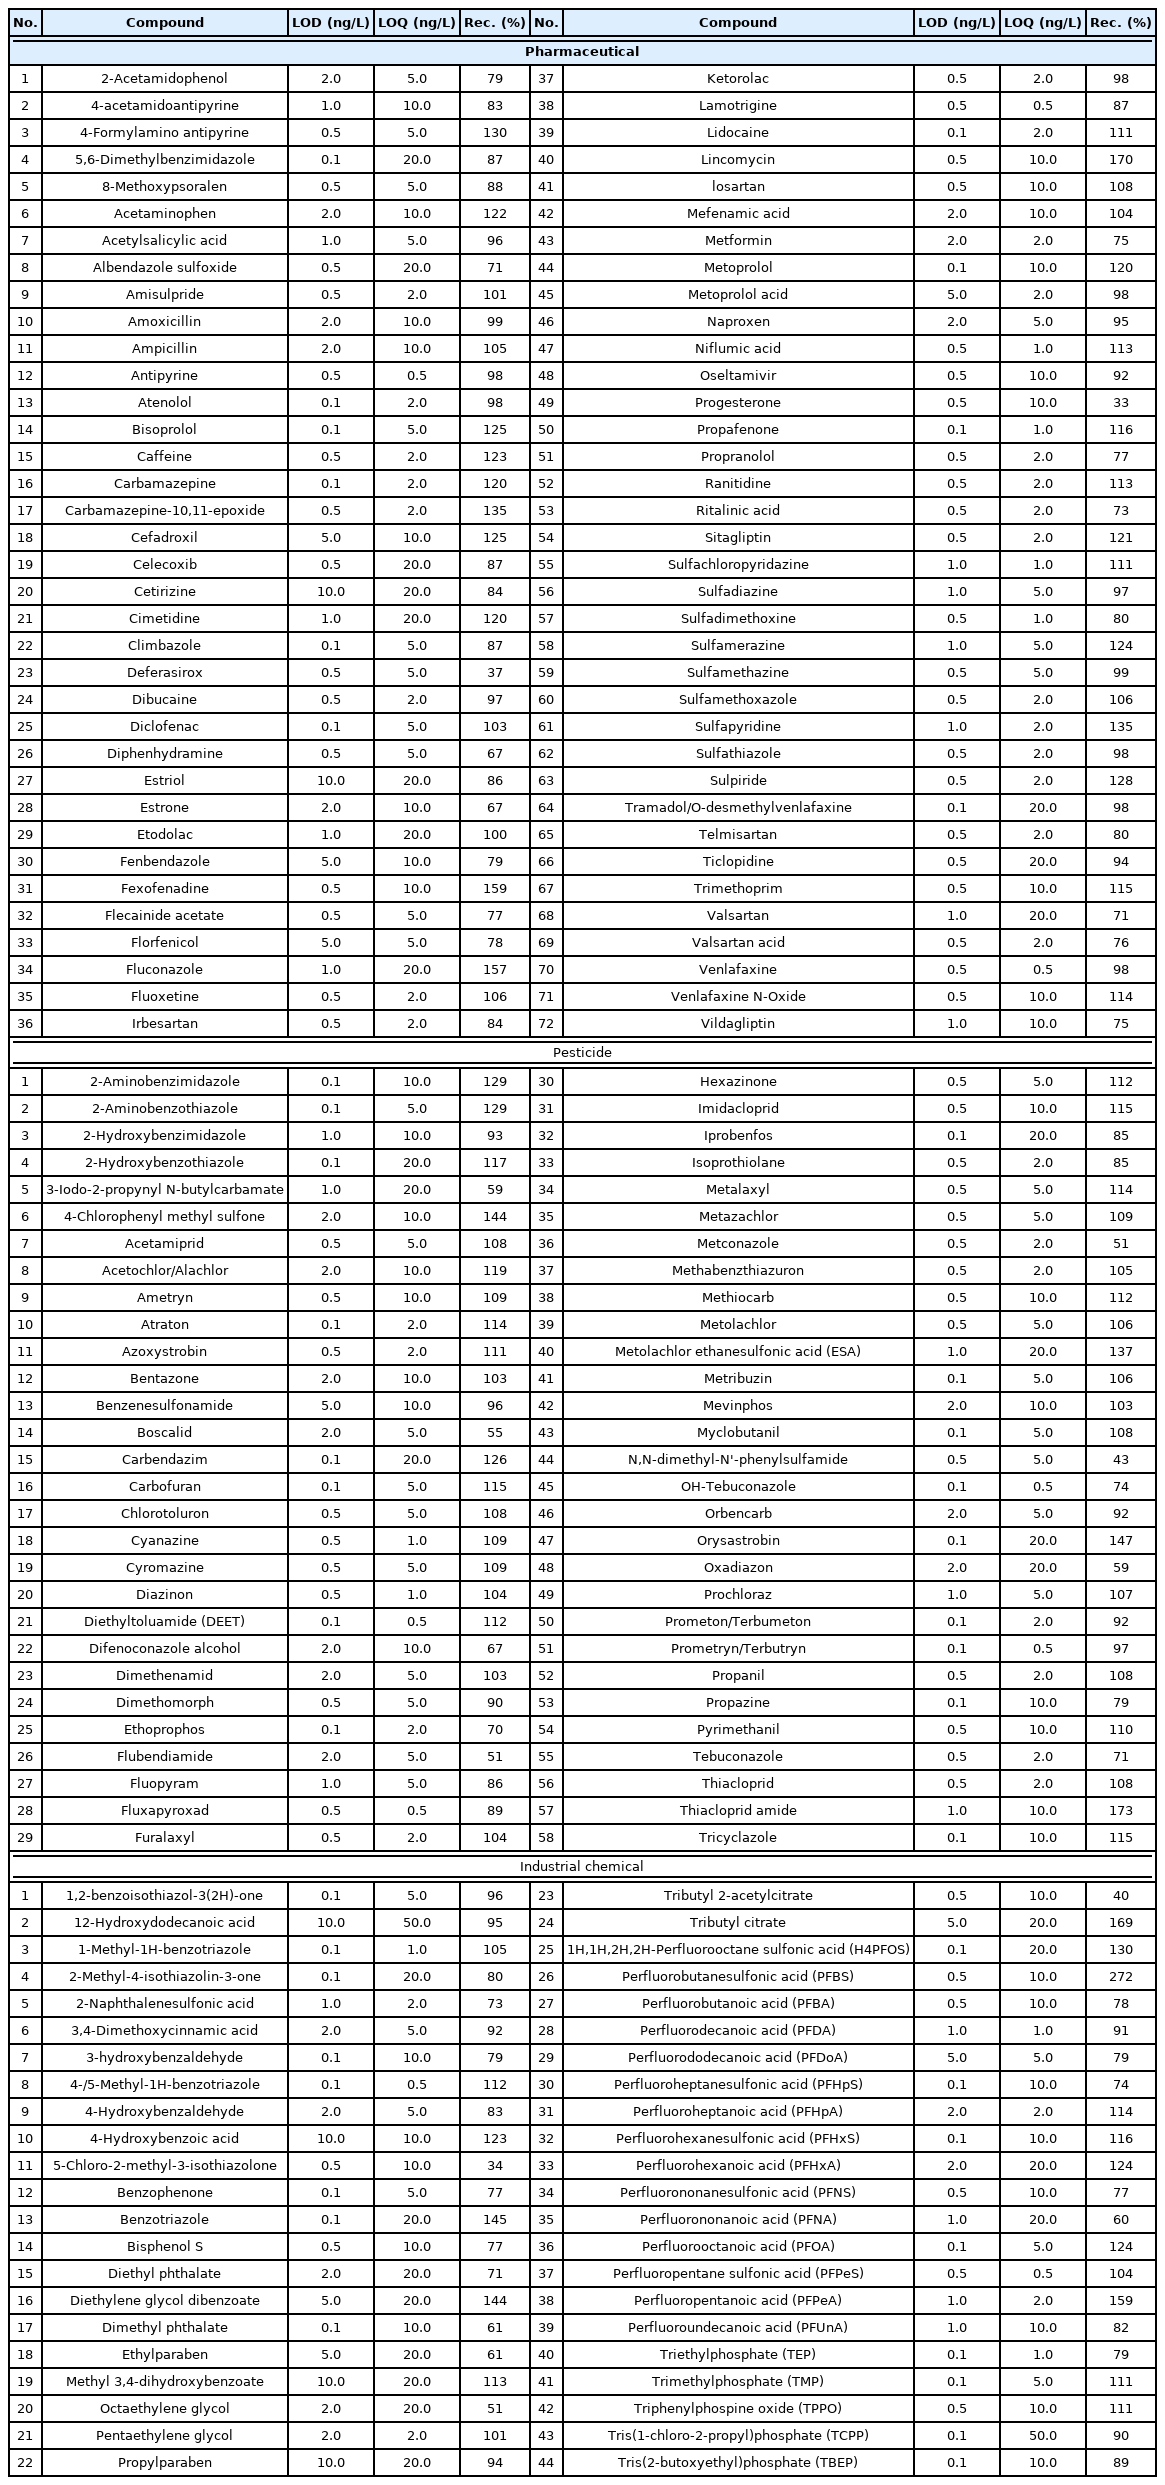
List of 174 target substances with information on limit of detection (LOD), limit of quantification (LOQ), and recovery (Rec.)
2.3. 전처리 및 분석 방법
시료 내 존재하는 대상물질의 추출을 위해 기존 연구에서 사용된 전처리 방법[25]을 동일하게 사용하였다. 간단히 설명하면, 0.7 μm로 여과된 1 L 시료에 68종의 내부표준물질 (Internal standard, ISTD)을 각각 100 ng 주입하고 각기 다른 4종의 SPE 재료 (Oasis HLB, Isolute ENV+, Strata X-AW 및 X-CW)로 구성된 다층 SPE 카트리지에 해당 시료를 통수 (loading)하였다. 그 후, 건조과정을 거친 카트리지는 6 mL ethyl acetate/methanol 50:50 v/v (conditioned with 0.5% ammonia) 용액과 3 mL ethyl acetate/methanol 50:50 v/v (conditioned with 1.7% formic acid)를 이용하여 추출하였다. 추출용액은 질소 가스를 이용하여 증발시킨 후 잔류 시료를 9:1의 비율로 혼합된 물과 메탄올을 주입하여 1 mL로 재구성하였다. 한편, 시료 또는 기타 오염원으로부터의 오염을 확인하기 위해 동일한 방법을 사용한 바탕실험을 수행하였다. 준비된 시료는 LC-HRMS를 사용하여 분석되었다. 준비된 추출액 10 μL을 고성능 액체크로마토그래피(HPLC)를 사용하여 XBridge C18 컬럼 (50 × 2.1 mm, 3.5 μm, Waters, USA)에 주입하였다. 컬럼 온도 35oC에서 이동상 (D.I water/methanol with 0.1% formic acid)을 사용하여 주입된 추출액을 HRMS 검출기로 이동시켰다. Full scan MS 스펙트럼 및 data-depen-dent MS/MS (ddMS2) 스펙트럼의 검출은 HESI 이온화 스프레이에서 (+) 또는 (−)로 이온화된 후 QExactive plus Orbitrap 질량분석기 (Thermo Fisher Scientific, San Jose, CA, USA)에서 수행하였다. HESI의 운전조건은 전압 3,800V/3,000V, 외장/보조 가스 flow 40/10AU 및 capillary 온도 320oC 등으로 설정되었다. Full scan MS 스펙트럼은 100~1,500 m/z의 질량 범위에서 검출되었고, 질량 분해능 140,000 및 최대 주입 시간 100 ms로 수행되었다. 한편, ddMS2 스펙트럼은 질량 분해능 175,000, 최대 주입 시간 50 ms 및 동적 배제 8S 등의 조건에서 검출하였다. 수집된 모든 데이터는 Xcalibur 4.0 (Thermo Fisher Scientific, San Jose, CA, USA)으로 처리되었으며 질량 정확도는 5 ppm 미만으로 확인하였다.
2.4. QA/QC
분석대상물질 174종에 대한 정량분석은 내부표준법을 사용하여 수행되었으며, 이에 대한 정도관리는 calibration curve의 직선성, 검출한계 (Limit of detection, LOD) 및 정량한계 (Limit of quantification, LOQ), 정밀도, 그리고 회수율 등을 통해 수행되었다.
3. 결과 및 고찰
3.1. QA/QC 결과
정량분석을 위한 calibration curve의 linearity를 나타내는 R2값은 대상물질에 대하여 모두 0.99 이상으로 높은 직선성을 나타내었다. 검출한계 (LOD)는 159종의 물질 (91.4%)에 대하여 2.0 ng/L 이하로 정량한계 (LOQ)는 142종의 물질 (81.6%)이 10.0 ng/L 이하로 나타나 높은 민감도를 보여주었다 (Table 1). 가장 높은 LOD와 LOQ를 나타낸 물질은 12-hydroxydodecanoic acid (LOD; 10.0 ng/L, LOQ; 50.0 ng/L)였다. 분석의 정밀도를 확인하기 위한 표준용액 분석값의 상대표준편차값 (Relative standard deviation, RSD)은 25.0% 이내로 나타나 준수한 정밀도를 보여주었다. 하천수를 대상으로 확인된 표적물질에 대한 회수율은 모두 33.5~272.4% 이내로 나타났고, 이들 중 128종 (73.6%)의 회수율은 75~125% 이내로 높은 회수율을 보여주었다.
3.2. 정량분석결과
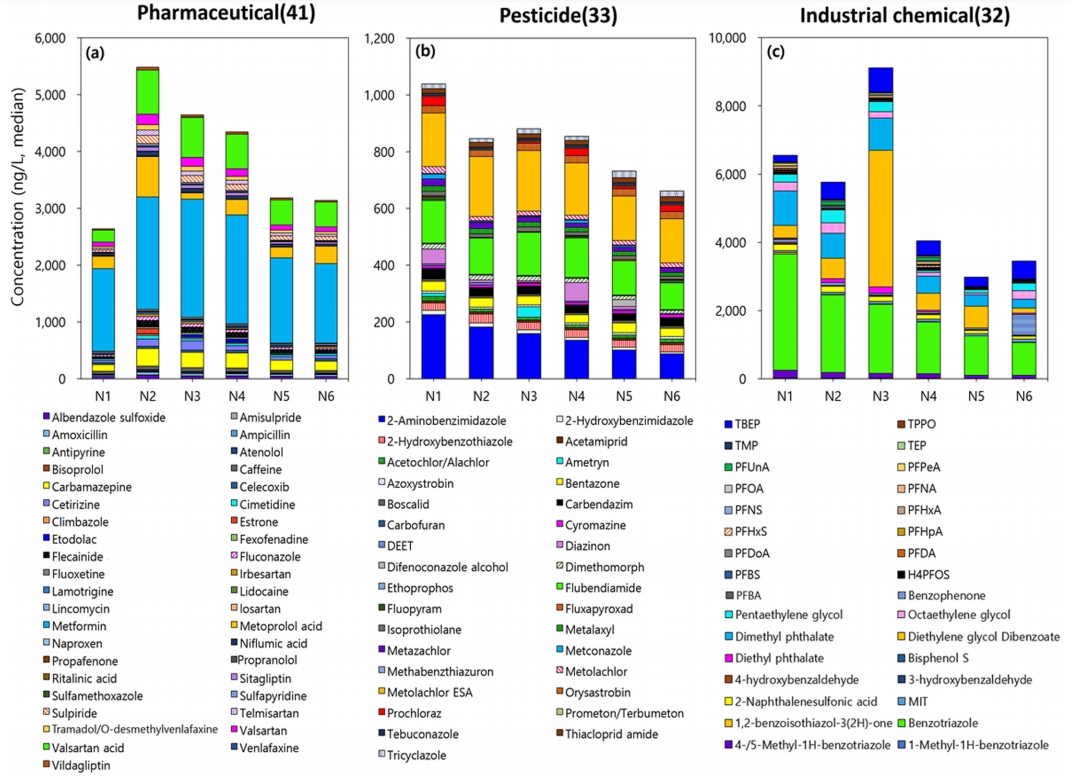
낙동강 중하류 6개 지점에 대한 정량분석결과 대상물질 174종 중 106종 (60.9%)이 LOQ 이상의 농도로 검출되었다. 이들 중 의약품은 41종, 농약은 33종, 산업용제 및 기타물질은 32종으로 확인되었다. 주요 오염물질은 방청제로 사용되는 benzotriazole이 최대 4,300 ng/L 로 검출되었으며, 이외에도, metformin, diethylene glycol dibenzoate 등이 최대 1,000 ng/L 이상으로 검출되었다(Fig. 2). 검출빈도 (Detection Frequency, DF) 100%를 보인 물질은 metformin, carbamazepine, caffeine, benzotriazole 등으로 낙동강 중하류에 상시적으로 존재하는 오염물질로 판단된다. 반면, etodolac, fluoxetine, ritalinic acid, carbofuran 등은 7.7% 이내의 검출빈도를 나타내 간헐적으로 유입되는 것으로 보인다. 물질그룹별로 나누어 보면, 의약품 중에서는 당뇨병 치료제 (metformin), 심혈관치료제 대사체 (valsartan acid/meto-prolol acid), 항경련제 (carbamazepine)가 200 ng/L 이상 높은 농도로 나타났다. 이외에 항우울제 (sulpiride/venlafaxine), 고혈압치료제 (valsartan/telmisartan) 등 주요 의약물질로 확인되었다. 농도 검출이 확인된 의약물질은 41종으로써 농약물질 및 산업용 물질에 비하여 상대적으로 많은 종류가 확인되었으며, 이는 낙동강 중 · 하류 수계로 하폐수 방류 유입이 그 원인으로 사료된다. 농약물질의 경우, 제초제 대사체 (metolachlor ethanesul-fonic acid (ESA)), 살충제 (flubendiamide)가 높은 농도범위 (median >ᅠ100 ng/L)를 나타내어 주요한 오염물질로 확인되었다. Metolachlor ESA는 제초제 metolachlor의 대표적인 생물학적 대사물질이며, 수환경 내에서 모화합물인 metolachlor에 비하여 높은 검출율과 잔류농도를 나타낸다고 알려져 있다[26,27]. 본 연구결과로 모화합물인 metolachlor (16 ng/L)에 비하여 대사물질인 metolachlor ESA가 10배 이상의 높은 농도 (180 ng/L)를 나타냈다. Metolachlor ESA의 검출빈도는 모화합물에 비해 3배 이상 증가한 100%로 확인되었다. Fluben-diamide는 토양 내 미생물에 대한 위해성은 상대적으로 적은 것으로 알려져 있지만, 네오니코티노이드 계열 살충제 (e.g., acetamiprid, imidacloprid, thiacloprid)와 마찬가지로 꿀벌 등에 대하여 치명적인 위해성을 나타낸다[28]. 이에 따라 미국환경청 (USEPA)에서는 해당 살충제 농약물질에 대한 생산 및 사용 금지를 권고하고 있다[29]. 낙동강 중하류 수환경 내에 flubendiamide 외 검출된 네오니코티노이드 살충제는 acetamiprid가 확인되었지만 상대적으로 낮은 농도 (7.9 ng/L)와 검출빈도 (67%)를 나타내었다. Imidacloprid와 thiacloprid의 경우 본 연구에서 정량한계 이하로 검출 확인되었으며, thiacloprid의 대표적인 대사물질인 thiacloprid-amide가 검출되었다 (농도; 17 ng/L, DF; 65%). Thiacloprid-amide는 모화합물인 thiacloprid의 니트릴작용기의 변환에 의하여 생물체에 대한 독성이 저감된 형태이다[30]. 이 외 낙동강 중 하류 수계 내에서 지속적으로 검출된 농약물질 (DF; 100%)은 azoxystrobin, boscalid, dimethomorph, fluxapyroxad로 확인되었다. 해당 4종의 물질들은 낙동강 외에도 국내 수계에서 빈번하게 출현하는 농약물질이며 유사한 농도 수준을 나타내었다[31]. Azoxystrobin과 fluxapyroxad는 살진균제 농약물질이며 농촌진흥청에서 제공하는 환경 내 잔류성이 높은 농약물질로 분류되어 있으며, 수환경 내에 장기간 잔류하며 위해성을 나타낼 것으로 예상된다[32]. 최근 2020년도 농약을 환경잔류분 정의 내에 metolachlor 또한 신규로 추가되었다. 측정된 median 농도 기준 상위 20위 내의 농약 분류할 경우 진균제 7종, 제초제 5종, 살충제 2종 외 대사물질 6종으로 확인되었으며, 살진균제 농약물질이 타 농약분류에 비해 상대적으로 높은 비율을 보이고 있다. 산업용제 및 기타 물질 중에서는 benzotriazole을 비롯하여 diethylene glycol dibenzoate, dimethyl phthalate가 높은 농도범위로 검출되었다. 유기인계난연제 (Organophosphate flame retardant, OPFR) tris(2-butoxyethyl) phosphate (TBEP)와 계면활성제인 pentaethylene glycol 또한 상대적으로 높은 농도 (median 농도; 410 ng/L, 230 ng/L)를 보여주었다. 한편, PFAS 물질은 총 13종이 확인되었는데 그 중 perfluoroundeanoic acid (PFUnA)가 가장 높은 median 농도 (97 ng/L)를 나타냈으며, per-fulorononaoic acid (PFNA), perfluorononane sulfonic acid (PFNS) 등이 그 뒤를 이었다 (Fig. 2). PFAS 물질들은 비록 높은 상대 농도를 보여주진 않았지만, 13종의 다양한 형태로 분포하여 낙동강 중 하류에 지속적으로 출현하는 것으로 판단된다. 각 물질그룹별 농도의 합 (median 값 기준)을 계산해보면, 산업용제 및 기타 물질이 4,900 ng/L로 가장 높은 농도 합을 보여주었다. 이는 최상의 농도범위를 나타낸 benzotriazole과 diethylene glycol diben-zoate가 가장 큰 요인으로 작용한 결과였다. 의약품과 농약의 농도 합은 각각 3,700 ng/L와 870 ng/L로 나타났다.

Quantitative results for (a) pharmaceuticals, (b) pesticides, and (c) industrial chemicals detected above limit of quantification. Each colors indicates the sub-class in each group classified by the usage.
3.3. 지점별 비교
시료채취 지점별 비교를 해보면 N3 지점에서 가장 많은 종(97종)의 미량오염물질이 검출되었으며, N6 지점에서는 가장 적은 수의 물질 (85종)이 확인되었다 (Fig. 3). 농도의 합 (median 값 기준)으로 비교해 보면 N3 지점에서 가장 높고 (14,000 ng/L), N2와 N1 지점이 그 뒤를 이었다. 대체적으로 상류지점에서 상대적으로 많은 종류의 물질이 검출되고 높은 농도로 정량되었는데, 대구지역에 주요 점오염원들 (e.g., 하폐수처리장 등)이 자리하고 있다는 사실을 뒷받침하고 있다. 물질그룹 별로 비교해 보면 의약품의 경우 대구 합류 후 N2 지점에서 가장 높은 농도합 (5,400 ng/L)을 보여주었고, 대구 하류로 갈수록 농도합이 낮아지는 경향을 보였다. Valsartan acid는 valsartan, losartan, irbesartan의 주요 대사물질로[33], 하수처리과정에서 기인된 오염물질로 보고되고 있다[34]. 대구 합류 후 N2 지점에서의 valsartan acid 농도는 N1 지점에 비해 약 2~10배 증가되었고, 1,100 ng/L 이상 검출되었다. 생활하수가 의약품의 주요 오염원임을 감안할 때, 합류지역(대구)에서 배출된 하수 방류수가 주요 원인으로 판단된다. 농약의 경우 N1 지점에서 가장 높은 농도합을 보여주었고, N3와 N2가 그 뒤를 이었다. 이는 의약품의 결과와 상이한 것으로, 농약의 주요 오염원은 대구 상류의 농경지역에 기인하는 것으로 판단된다. 하지만, 농약은 작물 경작시기에 따라 물질 및 사용량이 달라지므로, 추후 시기별 모니터링을 통해 주요 오염원을 파악하는 것이 필요할 것으로 보인다. 산업용제 물질은 N3 지점에서 가장 높은 농도합 (9,100 ng/L)을 보여주었고, N1와 N2가 그 뒤를 이었다. N3 지점이 가장 많은 농도합을 보인 것은 일부 산업용제 (e.g., diethylene glycol dibenzoate, TBEP)가 증가되었기 때문이다. 이는 인근 지류 및 배출시설에 영향을 받을 것으로 사료되며, 추후 N3 인근 지점의 오염원조사가 필요할 것으로 판단된다.
Accumulated concentration within 3 substance group ((a) pharmaceutical, (b) pesticide, and (c) industrial chemical) at each sampling sites.
3.4. 주요 미량오염물질 선정
낙동강 중하류의 효율적인 수질관리를 위해서는 우선관리물질을 선별하는 과정이 필요하다. 기존의 다양한 선행연구에서 수계 내의 미량오염물질의 우선순위 선정을 위한 다양한 방법들이 적용되어 왔다[35-38]. 본 연구에서는 검출된 미량오염물질 정량 농도 결과를 바탕으로 오염물질에 대한 우선순위 선정이 실시되었다. 정량 농도 결과 외 고려된 사항으로서, 1) 국내외 제도를 통하여 관리되고 있는 미량오염물질, 2) 대상 수계 내 검출빈도가 잦고 일정 수준 이상의 농도를 나타내는 물질, 3) 발암성 및 생물농축성 (Bioconcentration factor, BCF)를 이용하여 위해성이 높을 것으로 예상되는 물질을 선정하여 제안하고자 한다.
첫번째, 본 연구에서 검출된 물질 중, 국내 수질 관련 기준 (수질오염물질 지정 등에 관한 지침, 먹는물 수질감시항목 운영 등에 관한 고시)[39,40]에 포함되어 관리대상으로 지정된 물질은 총 7종이다. 수질오염물질 지정 등에 관한 지침 내 우선순위물질로 등록되어 있는 미량오염물질 중, 본 연구 정량 농도 결과를 나타낸 물질은 3종으로 carbofuran, diazinon, iprobenfos가 이에 해당한다. 위 3종의 농약물질은 2018년 3월 개정을 통하여 수질오염물질로 지정되었으며 모두 3A 등급에 해당한다. 이 중 diazinon과 iprobenfos는 유기인계열 살충 농약물질이며 diazinon의 경우 먹는물 수질기준항목에 해당한다. 이 외에 먹는물 수질감시항목 운영 등에 관한 고시 내 먹는물 수질감시항목으로 등록되어 있는 물질은 PFHxS, PFOA, PFOS, alachlor이다. PFHxS, PFOA, PFOS는 모두 2018년 해당 고시 개정을 통하여 수질감시항목으로 추가되었으며, 해당물질에 대하여 일간 시설용량 50,000톤 이상의 정수장을 대상으로 주기적인 검사가 요구되고 있다. PFOA, PFOS를 포함한 많은 과불화합물질은 전세계적으로 생산 및 사용에 대한 규제가 실시되고 있지만, 규제 대상 물질을 대체하여 짧은 체인 형태의 대체 과불화합물질이 활발히 사용되고 있다[41,42]. 이에 따라 감시항목 기준 물질 (PFHxS, PFOA, PFOS) 외 5종의 짧은 체인 구조를 가진 과불 화합물질 (PFBS, PFBA, PFHpA, PFHxA, PFPeA)을 추가적으로 제안하고자 한다. 두번째, 낙동강 중 하류 수계 내에서 검출빈도와 농도가 높은 물질들이 선정되었다. 낙동강 수계 내에서 검출빈도 절반 이상을 나타내는 물질에 대하여 측정된 농도와 검출빈도를 이용하여 우선순위가 선정되었다. 해당 물질 19종은 albendazole sulfoxide, amoxicillin, atenolol, benzotriazole, carbamazepine, carbendazim, cetirizine, cimetidine, dimethyl phthalate, metformin, metolachlor, metoprolol acid, sulfapyridine, sulpiride, TBEP, telmisartan, tramadol, valsartanic acid, valsartan 이에 해당된다. 마지막으로, 발암성 위험을 가지거나 생물농축성이 높을 것으로 예상되는 물질 또한 우선관리항목에 포함되어야 한다. 발암성 여부는 Hazardous Substances Data Bank (HSDB, https://www.nlm.nih.gov/toxnet/index.html)에서 제공되는 정보를 활용하였다. HSDB 정보 내에 발암성위험을 나타낼 것으로 예상되는 물질 중 대상물질로 포함되어 있는 물질은 총 4종으로 carbofuran, cyanazine, diazinon, iprobenfos 이다. 이 중 carbofuran, diazinon의 median 농도는 각각 5.3 ng/L, 9.7 ng/L로 나타났으나 그 출현빈도는 2.0%와 12.0%로 낮은 것으로 확인되었다. 생물농축성은 미국환경청 (USEPA)에서 제공하는 QSAR (Quantitative structure activity relationship) 모델 EPI suiteTM 소프트웨어를 이용하여 생물농축계수 (BCF)를 계산하였다. BCF 값은 USEPA에서 제시한 기준에 의거하여 농축 정도를 판단하였다 (BCF <100;low potential, 100~5,000; threshold for concern, 5,000 <; high potential, uncertainty factor; 0.5). 이에 따라, 낙동강 중 하류 환경 내 출현하는 오염물질 중 생물농축 정도가 높을 것으로 예측된 물질은 14종으로 acetochlor/ alachlor, climbazole, diazinon, diphenhydramine, ethoprophos, flecainide, flubendiamide, fluxpyroxad, iprobenfos, irbesartan, losartan, progesterone, tebuconazole, venafaxine 이 이에 포함된다. 이 중 fluxapyroxad, irbesartan, tebuconazole, telmisartan의 경우 본 연구 내에서 100%의 검출빈도를 나타내어 낙동강 중 하류 수계 내에서 높은 위해성을 나타낼 것으로 예상된다.
일부 물질들은 상기 3가지 기준 중 2개 이상 만족하여 중복 선정되었으며 (e.g., acetochlor/alacholr, climbazole, fluxapyroxad, irbesartan, tebuconazole, telmisartan), 한가지 이상 기준을 충족한 물질은 총 44종으로 Table 2에 나타내었다. 이들 미량오염물질은 검출빈도 및 농도, 독성 및 생물농축성 등을 고려할 때 낙동강 중 하류에서 우선적으로 모니터링 및 관리되어야 할 물질로 사료되며, 추후 추가적인 연구결과에 따라 배출원 관리 및 수질기준안 마련 등의 후속관리대책이 필요할 것으로 판단된다.
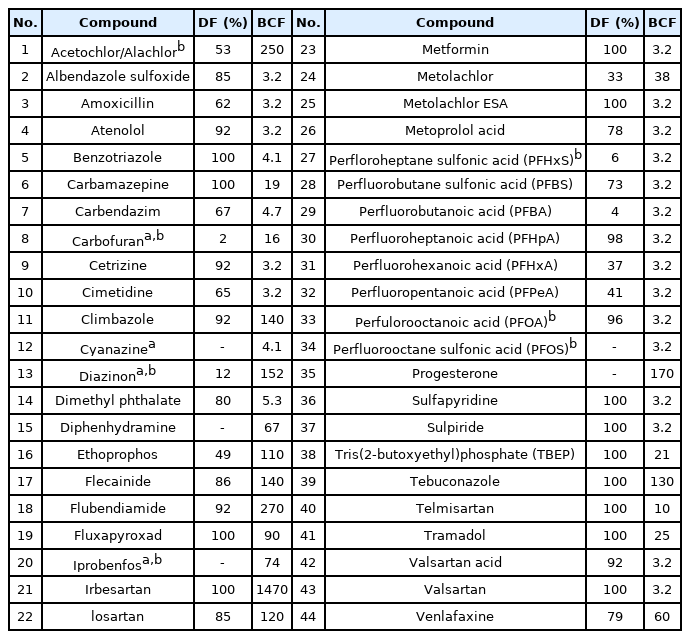
Priority substances suggested in the present study (aconcerned with high cancer risk. bdesignated by the domestic regulation).
4. 결 론
본 연구에서는 낙동강 중하류에 출현하는 신종 미량 오염물질 현황을 파악하기 위해 174종의 물질에 대한 LC-HRMS기반 정량분석을 수행하였다. 그 결과 총 106 종의 물질이 LOQ 이상의 농도로 검출되었고, 주요 오염물질로는 방청제로 사용되는 benzotriazole, 당뇨병 치료제 metformin, 계면활성제 diethylene glycol dibenzoate 으로 약 1,000 ng/L 이상 농도로 검출되었다. 각 그룹별 주요물질을 살펴보면, 의약품 중에서는 metformin, valsartanic acid, metoprolol acid, carbamazepine, 농약류에서는 metolachlor ESA, 2-aminobenzimidazole, flubendiamide 그리고, 산업용제 및 기타 물질에서는 benzotriazle, diethylene glycol dibenzoate, dimethyl phthalate이 높은 농도범위를 보여주었다. 시료채취 지점별로 비교해 보면, N3 지점에서 가장 많은 종류의 물질이 검출 (97종)되었고, 높은 농도합 (14,000 ng/L)을 나타냈다. 대구지역 합류 이후로 의약품과 산업용제 및 기타물질의 농도가 급격히 증가하다가 감소하는 경향이 확인되었다. 검출된 미량오염물질을 대상으로 국내외 수질기준, 검출농도 및 빈도, 독성 등을 고려한 결과 총 44종의 물질이 우선순위물질로 선정되었다. 이들 물질은 낙동강 중하류에서 우선적으로 관리되어야 할 물질들로 판단되며, 낙동강 수계 관리 및 모니터링 계획 수립 시 주요 관리대상물질로 제안하고자 한다.
Acknowledgements
이 논문은 2019~2020년도 창원대학교 자율연구과제 연구비 지원으로 수행된 연구결과임.