국내 환경대기 중 사용된 농약류의 분포 특성 연구
A Study on Distributional Characteristics of Pesticides used in the Atmosphere of South Korea
Article information
Trans Abstract
Over the past few decades, historic-use pesticides (HUPs), as commonly known as organochlorine pesticides (OCPs), have been widely used in agricultural fields. Since these chemicals were banned throughout the world due to their environmental persistence, toxicity, and long-range atmospheric transport, however, current-use pesticides (CUPs) have been used as alternatives, and today both HUPs and CUPs are frequently detected in the environment. Therefore, this study aimed to understand the characteristics of HUPs and CUPs by exploring the target pesticides in the atmosphere. In this study, samples were collected at three main sites in South Korea for three consecutive days every month for one year. The annual concentrations in the atmosphere were 184.97±15.83 pg/m3 for HUPs and 1,226.43±1,333.47 pg/m3 for CUPs. The concentration distributions showed that most HUPs and CUPs reached the highest levels in summer, while falling to the lowest levels in winter. The results of the concentration levels with spatial and seasonal variations indicate that the emission sources of these pesticides were influenced by long-range atmospheric transport from a contaminated area and/or revolatilization related to regional factors. These findings can potentially serve as a preliminary assessment tool for identifying the origins of these pesticides in the atmosphere.
1. 서 론
과거에 사용된 농약류 (historic-use pesticides, HUPs)는 전 세계적으로 농산품의 생산 효율 및 품질 향상을 위해 광범위하게 사용되어왔다[1]. 이처럼, HUPs는 식량 생산에 있어 중요한 역할을 했음에도 불구하고, 잔류성, 생물농축성, 독성 및 장거리 이동성 등으로 인한 이들의 환경과 인체에 대한 위 · 유해성이 입증되었다. 현재 HUPs는 잔류성유기오염물질 (persistent organic pollutants, POPs)에 관한 스톡홀름협약 (Stockholm Convention)에 등재되어 국제적으로 생산 및 사용이 금지되었다[2-3]. 2004년 12종의 POPs가 처음 등재된 이후로 지속적으로 등재물질들에 대한 검토 및 논의가 진행되고 있으며, 최근 2023년도 제11차 당사국총회에서는 유기염소계 농약류인 메톡시클로르 (methoxychlor)가 부속서 A (금지)에 등재 결정되었다[4].
최근 사용 농약류 (current-use pesticides, CUPs)는 HUPs에 비해 상대적으로 낮은 잔류성 및 독성을 갖고 있을 뿐만 아니라 쉽게 생분해되도록 고안되어 환경에 미치는 영향이 적은 것으로 알려져 있었다[5]. 이러한 특징은 전 세계에서 CUPs의 생산과 사용을 공식적으로 허가되는 계기가 되어 이들의 소비량이 기하급수적으로 증가하는 결과를 야기하였다[6]. 그러나, CUPs 또한 환경 매체에서 빈번하게 또는 높은 농도로 검출되고 있으며[7-9], 심지어는 사용된 이력이 없거나 오염 지대로부터 멀리 위치한 극 지역에서도 발견되고 있다[10-11].
HUPs (DDTs, HCHs, heptachlor, aldrin, dieldrin, endrin 포함)는 1970년대에 금지되기 전까지 국내에서 3,500톤 이상이 사용되었으며[12], 그 이후에는 주로 카바메이트 (carbamate), 피레스로이드 (pyrethroid), 네오니코티노이드 (neonicotinoid)계 등의 CUPs로 대체되어 사용되었다[13-14]. 특히, 2000년대에 사용된 CUPs의 사용량은 약 26,100톤에 달하였으며, 2010년 이후에는 다소 감소한 수준인 19,000톤가량이 사용된 것으로 보고되었다[15]. 이렇게, 우리가 사용하고 있는 농약류는 다양한 용도 (살충제, 살서제 등)로 활용되고 있으며 사용량이 지속적으로 증가, 새로운 종류의 농약들 또한 만들어지고 있는 실정이다[16].
그러나, 과거 또는 현재에 사용되고 있는 농약들은 여전히 환경 매체 및 수·생태계에서 검출되고 있으며, 이러한 농약류들의 검출과 거동 특성에 관한 연구는 지속해서 추진되고 있다[17-18]. 그럼에도 불구하고, 신규물질들이 농약으로 개발·사용되고 있음이 보고되고 있고, 2004년 스톡홀름협약이 처음 발효된 이후 협약에 등재 및 국제적으로 관리되고 있는 농약류 (‘04년 12개 농약, ’23년 18개 농약)도 증가하고 있는 추세이다. 따라서, 이러한 농약류에 대한 국내에서의 선제적 관리 강화를 위해서는 이들의 분포 특성을 이해하는 것이 반드시 수행되어야 한다. 즉, 기존 농약류 (HUPs 및 CUPs)를 포함하여 환경 매체 내 지속적인 모니터링 수행을 통해 국내에서의 검출 여부 및 농도 수준을 조사하고, 검출된 물질들의 장거리 이동 특성을 파악하는 등 다양한 농약류들의 분포 및 거동 특성을 이해하기 위한 연구가 반드시 추진되어야 한다[19-20]. 또한, 다수의 선진국에서는 다양한 환경 매체에서의 장기적 및 계절별 대기 모니터링 연구를 수행함으로써 인체의 노출 농도 추정에 사용되는 데이터를 생성하고, 이로부터 잠재적인 건강 위험을 평가함과 동시에 이를 스톡홀름협약 이행성과평가 및 국가 차원의 규제·관리의 효율성을 평가하는데 적극 활용되고 있다[21-22].
본 연구에서는 2021년도 국내 환경대기에서 21종의 HUPs 및 7종의 CUPs 평균 농도 수준을 조사하였으며 이를 통해 조사된 지역 (도시, 농업 · 중공업 복합, 배경지역)별 및 계절별 분포 특성을 파악하였다.
2. 재료 및 방법
2.1. 조사대상 물질 선정
본 연구에서는 스톡홀름협약 등재 물질이며, 국가 POPs 측정망의 조사항목 (환경대기; 연속 3일/회, 2회/년)으로서 지속적으로 국내에서 모니터링 하고 있는 21종의 HUPs (α-/β-/γ-/δ-HCH, cis-/trans-chlordane, cis-/trans-nonachlor, oxychlordane, o,p’-/p,p’-DDE, o,p’-/p,p’-DDD, o,p’-/p,p’-DDT, α-/β-endosulfan, o,p’-/p,p’-dicofol, PeCB, HCB)와 이들의 대체물질로 사용되고 있는 7종의 CUPs (alachlor, atrazine, bifenthrin, carbaryl, chlorpyrifos, permethrin, trifluralin)를 조사대상 물질로 선정, 총 28종의 농약류를 분석하였다.
2.2. 시약 및 기구
19종 HUPs의 표준물질, 정제·실린지·검정곡선용 표준물질은 Cambridge Isotope Laboratories (Tewksbury, Massachuestts, USA)에서 구입하였고, 2종 HUPs (디코폴)의 표준물질, 정제 및 실린지용 표준물질은 각각 o2Si smart solutions (Charleston, South Carolina, USA), Cambridge Isotope Laboratories (Tewksbury, Massachuestts, USA), Dr. Ehrenstorfer (Augsburg, Germany)에서 각각 구입하였으며, 검정곡선용 표준물질은 직접 필요한 농도로 희석하여 사용하였다. 7종 CUPs의 표준물질, 정제·실린지용 표준물질은 각각 Dr.Ehrenstorfer (Augsburg, Germany)와 Cambridge Isotope Laboratories (Tewksbury, Massachuestts, USA)에서 구입하였으며, 검정곡선 표준물질은 분석에 필요한 농도로 직접 조제하여 사용하였다.
본 연구에서 사용한 아세톤, 헥세인, 다이클로로메테인,톨루엔, 아세토나이트릴, 에틸아세테이트는 잔류농약 분석용 (pesticide residue analysis, PRA)으로 Wako Pure Chemical Industries (Osaka, Japan)에서, 노네인은 Merck (Darmstadt, Germany)에서 구입하여 사용하였다. 전처리 과정에 사용된 중성 실리카겔 (0.063-0.200 mm, 70-230 mesh ASTM)과 플로리실 (60-100 mesh)은 각각 Merck (Darmstadt, Germany)와 Thermo Fisher Scientific (Waltham, Messachuestts, USA)에서 구입하여 130oC에서 18시간 활성화 시킨 후 데시케이터에서 방냉하여 사용하였고[23], 무수황산나트륨은 Kanto Chemical (Tokyo, Japan)에서 구입 후 200oC에서 24시간 이상 가열하여 수분을 제거한 후 사용하였다[24]. 나일론 실린지 필터 (0.22 μm pore size, 17 mm diameter)는 GVS (Bologna, Italy)에서 구입하여 사용하였다.
환경대기 시료채취 흡착제인 폴리우레탄폼 (polyurethane foam, PUF, 84 mm diameter × 50 mm height)과 활성탄 수지 펠트 (activated carbon felt, ACF, 84 mm)는 Sibata Scientific Technology (Saitama, Japan)에서 구입하였고, 석영 섬유 필터 (quartz fiber filter, QFF, 203 × 254 mm)는 Whatman (Buckinghamshire, UK)에서 구입하여 사용하였다.
실험에 사용된 모든 초자류는 아세톤, 헥세인, 다이클 로로메테인의 순으로 세척하였으며, 초자에 남아있는 유기용매를 제거하기 위해 300oC에서 1시간 이상 가열한 후 사용하였다. 또한, 시료채취에 앞서 PUF 및 ACF는 속슬레 추출장치를 이용하여 아세톤/헥세인 (1:1, v/v) 혼합용액 500 mL로 16시간 이상 세척한 후 감압 건조하여 사용하였으며, QFF는 600oC로 5시간 이상 가열하여 흡착제 내 유기물을 제거한 후 사용하였다.
2.3. 시료채취
국내 환경대기 중 HUPs와 CUPs의 농도 수준 조사 및 장거리 이동에 의한 국외 오염원으로부터의 유입 영향을 분석하기 위해 Fig. 1과 같이 서울 (도시지역, A), 서산 (농업 · 중공업 복합지역, B), 제주 (배경지역, C)의 3개 지점을 선정하여 2021년 1월부터 12월까지 1년간 모니터링을 수행하였다. 시료채취는 잔류성유기오염물질 공정시험기준 (ES 10100.a, 2018)에 준하여 수행하였으며, 고용량 공기시료채취기 (high volume air sampler, HV-1000F, Sibata Scientific Technology, Saitama, Japan)를 이용하여 700 L/min의 유속으로 24시간 연속 시료를 3일간 채취하였다.
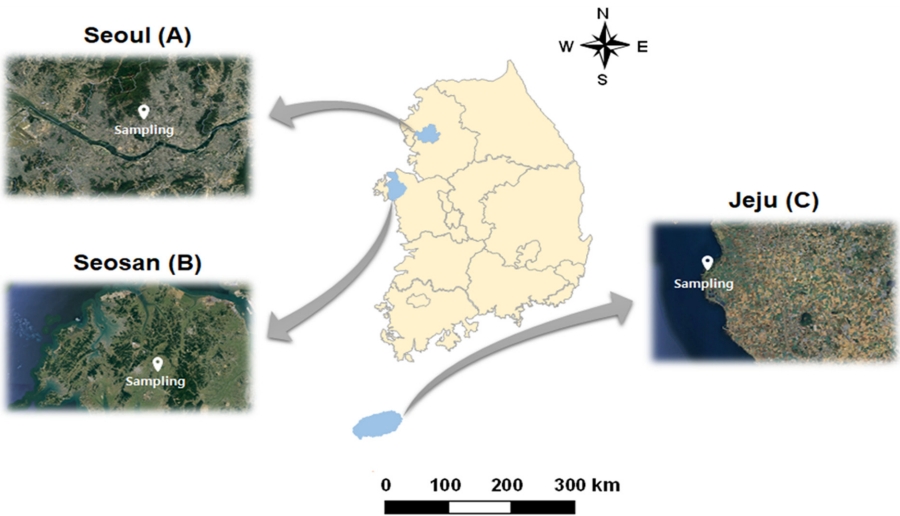
Location of sampling sites in South Korea.
2.4. 전처리 및 기기분석
2.4.1. 시료 추출
환경대기 시료의 전처리와 분석절차는 잔류성유기오염물질 공정시험기준 (ES 10900.1a)에 따라 수행하였으며, 이에 대한 세부적인 과정을 Fig. 2에 나타내었다. 고용량 공기시료채취기를 이용하여 채취한 흡착제 (PUF, ACF, QFF)를 속슬레 추출관에 넣고 다이클로로메테인 500 mL 를 가하여 16시간 이상 추출한 후, 무수황산나트륨으로 탈수하였다. 회전증발농축기 (N-1300, EYELA, Tokyo, Japan)와 질소농축기 (N-EVAP 112, Organomation, Berlin, Connecticut, USA)를 이용하여 추출액을 농축하고 헥세인으로 용매를 전환하였다.
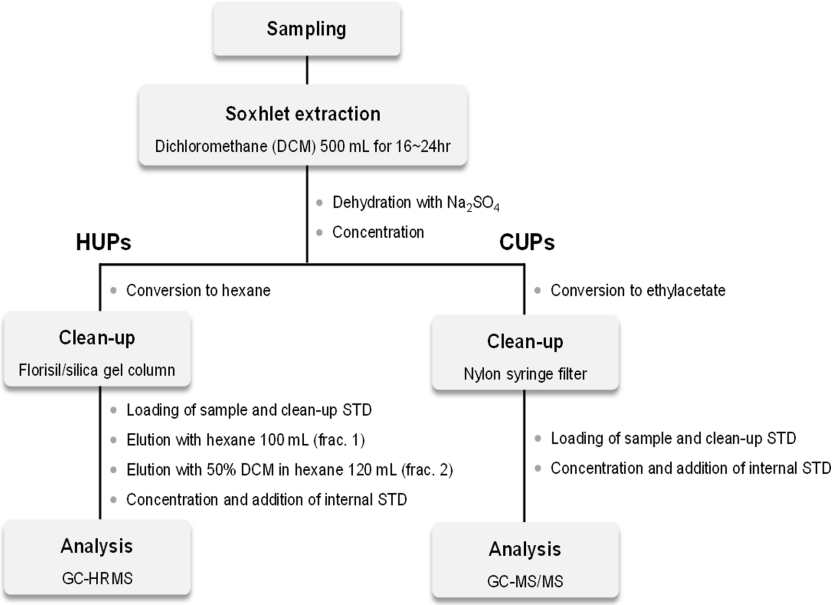
Flow chart of sample pretreatment procedures for HUPs and CUPs analyses.
2.4.2. 정제 및 기기분석
HUPs의 정제를 위해 유리 컬럼에 무수황산나트륨 2 g, 플로리실 5 g, 중성 실리카겔 5 g, 무수황산나트륨 2 g을 순차적으로 충진하여 플로리실/실리카겔 컬럼을 제작하였다. 헥세인 100 mL를 가하여 충진된 컬럼을 활성화시킨 후, 정제용 표준물질이 첨가된 추출액 1 mL를 컬럼에 주입하였다. 헥세인 100 mL로 용출하고 (1 분획), 이어서 동일한 둥근바닥플라스크에 50% 다이클로로메테인/헥세인 (1:1, v/v) 120 mL를 가하여 용출하였다 (2 분획).25 회전증발농축기와 질소농축기를 이용하여 전체 용출액을 80 μL까지 농축하고 나서, 실린지 표준물질을 각각 10 μL 주입하여 최종부피 100 μL가 되도록 하였다. 최종 농축된 시료는 GC (gas chromatograph)-HRMS (high resolution mass spectrometer)로 분석하였으며, 세부적인 기기분석 조건은 Table 1에 나타내었다.

Instrumental conditions of GC-HRMS for the analysis of HUPs
CUPs의 정제를 위해 질소농축기를 이용하여 추출액 1 mL를 에틸아세테이트로 용매 전환한 후, 정제용 표준물질을 주입하여 총 900 μL의 부피가 되도록 하였다. 정제용 표준물질이 주입된 시료를 나일론 실린지 필터로 여과하고 실린지 표준물질을 100 μL 주입하여 최종부피 1 mL가 되도록 하였다[6]. 최종 농축시료는 GC-MS/MS로 분석하였으며, 세부적인 기기분석 조건은 Table 2에 나타내었다.
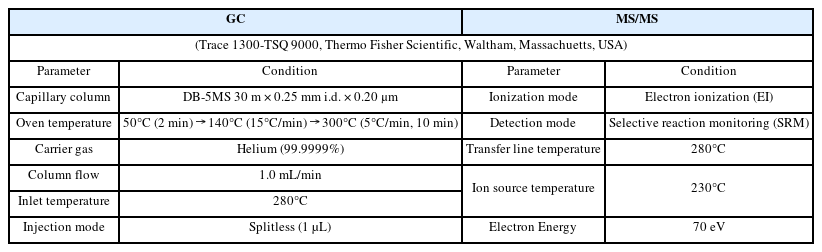
Instrumental conditions of GC-HRMS for the analysis of CUPs
2.5. 정도관리 (QA/QC)
본 연구에서는 조사대상 물질의 방법검출한계 (method detection limit, MDL), 정밀도 (precision) 및 정확도 (accuracy)를 산출하여 전반적인 시험방법의 내부 정도관리를 수행하였으며, 현장 바탕시료 (field blank) 및 방법 바탕시료 (method blank)를 통하여 환경대기 시료채취에서부터 전처리, 분석 등 전체 실험과정에서의 오염 가능성을 지점별로 매월 점검하였다.
HUPs와 CUPs의 시험방법에 대한 정도관리 (QA/QC) 결과는 Table 3에 나타내었다. 방법검출한계는 각각의 대상 표준물질이 주입된 7개 시료의 분석값에 대한 표준편차에 3.14 (student’s t-value)를 곱하여 계산하였으며, 모든 시료에 대해 MDL 이하의 농도 값 및 S/N비 (signal-to-noise ratio)가 2.5 이하인 경우에는 N.D. (not detected)로 처리하였다.

Summary of quality assurance/quality control (QA/QC) of HUPs and CUPs (mean±SD).
지점별 현장 바탕시료 (field blank)와 방법 바탕시료 (method blank)는 환경대기 시료와 동일한 전처리 과정을 거쳐 분석되었으며, 두 바탕시료에서 조사대상 물질들은 검출되지 않거나 방법검출한계 이하의 농도 수준을 보였다.
2.6. 통계분석
환경대기 중 조사대상 물질의 농도 분포 특성에 관한 도표는 SigmaPlot version 12.0 (Systat Software Inc., San Jose, California, USA)을 이용하여 도식화하였으며, 농도 수준과 계절 간의 피어슨 상관성 분석 (Pearson correlation)은 SPSS version 20.0 (SPSS Inc., Chicago, Illinois, USA)를 이용하여 수행하였다.
3. 결과 및 고찰
3.1. 지역별 농도 분포 특성
조사된 지역에서의 환경대기 중 조사대상 농약류 (21종의 HUPs 및 7종의 CUPs) 분석 결과 (‘21년도 1월~12월, 평균 농도)를 Table 4에 나타내었다. ΣHUPs의 평균 농도는 184.97±15.83 pg/m3였으며, ΣCUPs는 1,226.43 ± 1,333.47 pg/m3 수준으로 검출되었다. 국내·외에서 스톡홀름협약에 의해 규제·관리되고 있는 ΣHUPs에 비해 현재까지도 사용되고 있는 ΣCUPs가 상당히 높은 농도 분포를 보였다.

Summary of atmospheric mean concentrations of HUPs and CUPs in South Korea
3.1.1. HUPs 농도 분포
과거에 사용된 유기염소계 농약류 (organochlorine pesticides, OCPs)의 일종인 CBs, HCHs, CHLs, DDTs, EnSFs, Dicofols은 스톡홀름협약 부속서 A에 등재된 POPs 물질로서 국내·외적으로 관리되고 있다[26]. 우리나라에서도 협약에 따라 OCPs의 생산과 사용을 금지하였음에도 불구하고, 최근까지도 대부분의 물질들이 환경대기 중에서 여전히 검출되고 있다[27-28]. 조사 기간 각 지역에서 측정된 ΣHUPs의 평균 농도 분포를 Fig. 3(a)에 나타내었다. 서울(도시지역, A), 서산(농업 · 중공업 복합지역, B), 제주 (배경지역, C)에서의 ΣHUPs 평균 농도는 각각 169.76±17.83 pg/m3, 251.65±49.37 pg/m3, 133.48±14.06 pg/m3로 서산, 서울, 제주의 순으로 감소하였으며, 특히 농업 · 중공업 복합지역인 서산에서는 배경지역인 제주에 비해 약 2배의 고농도 분포 특성이 나타났다.
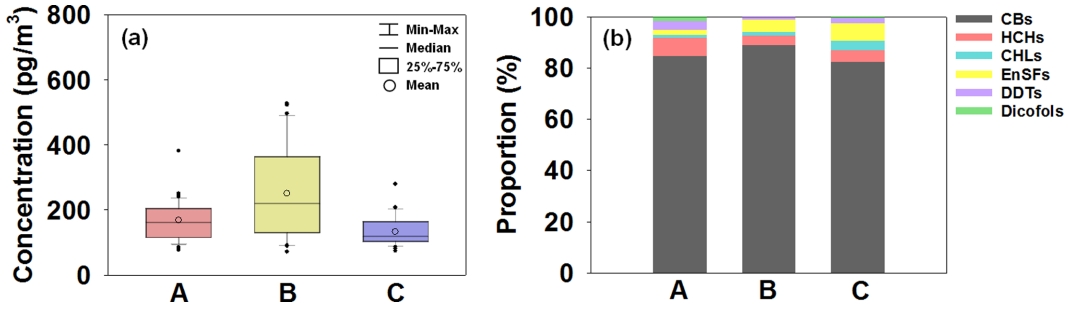
(a) Atmospheric concentrations and (b) compositional proportions of ∑HUPs at the study sites in South Korea.
추가적으로, 각 지역에서의 ΣHUPs 조성 분포를 Fig. 3(b)에 나타내었다. CBs은 모든 지역에서 동일하게 고농도로 검출되는 경향을 보였으며 (ΣHUPs 농도의 85.9%), 그 외 농약류의 분포 패턴은 지역에 따라 다소 다르게 나타났지만, 전반적으로 HCHs (ΣHUPs 농도의 5.0%)와 EnSFs (ΣHUPs 농도의 4.5%)이 높게 검출되었다.
3.1.1.1. CBs
클로로벤젠 (chlorobenzenes, CBs)의 일종인 PeCB와 HCB는 린데인 (lindane) 및 클로로탈로닐 (chlorothalonil)과 같은 살균제 생산공정에서 발생하는 불순물로 보고되었다[29]. 스톡홀름협약에 의해 사용이 2009년 및 2004년도에 각각 금지된 이후로 현재까지 전 세계적으로 생산과 사용에 대해 공식적으로 확인된 바는 없으나, 비의도적으로 산업시설, 폐기물 및 바이오매스 연소와 같은 다양한 공정 부산물로서 환경대기에 배출되고 있는 것으로 보고되었다[30].
본 연구에서 조사된 국내 환경대기 중 CBs의 평균 농도 분포와 조성 비율을 Fig. 4에 나타내었다. CBs의 평균 농도는 157.80±99.24 pg/m3 (ΣHUPs의 85.9% 수준)로 서산(B, 223.80±137.55 pg/m3), 서울 (A, 143.56±52.03 pg/m3), 제주 (C, 109.71±42.35 pg/m3)의 순으로 감소하였다. 특히, CBs의 평균 농도 수준이 ΣHUPs의 대부분을 대표하는 특성을 나타내었으며, 농업 · 중공업 복합지역인 서산에서는 배경지역인 제주보다 약 2배 높게 검출되는 결과를 통해 조사지점 인근에 위치한 다양한 산업 공정에서의 비의도적 배출로 인한 지역적 특성이 반영된 것으로 추측된다.
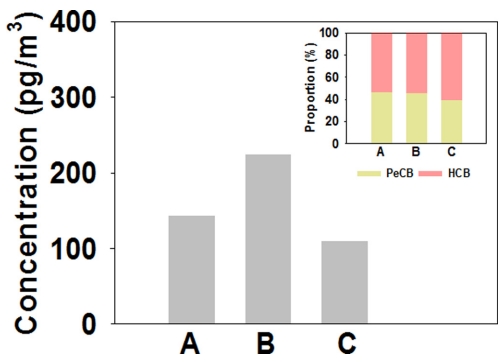
Atmospheric concentrations of CBs at the study sites in South Korea (Inset: Compositional proportions of CBs).
3.1.1.2. HCHs
헥사클로로사이클로헥세인 (hexachlorocyclohexanes, HCHs)은 유기염소계 살충제 중 하나로, 주로 technical HCH와 린데인 (lindane, γ-HCH)이 광범위하게 사용되었다. Technical HCH는 4가지 이성질체 [α-HCH (55-80%), β-HCH (5-14%), γ-HCH (8-15%), δ-HCH (2-16%)]로 이루어진 혼합물로 사용되었으나, 1950년대부터 많은 국가에서 사용 중단됨에 따라 순수한 lindane (γ-HCH > 99%)으로 대체되어 사용되었다[31]. 이성질체 중 α-HCH, β-HCH, lindane은 2009년에 스톡홀름협약 부속서 A에 등재되었으나, lindane은 특정면제 (머릿니, 옴 치료제)를 포함하여 등재되었으며, 비교적 최근인 2019년까지 중국에서 사용되었음이 보고되었다[32].
국내 환경대기 중 HCHs의 평균 농도 분포와 이성질체 조성 비율을 Fig. 5에 타내었다. HCHs의 평균 농도는 9.18±5.73 pg/m3 (ΣHUPs의 5.0% 수준)로 서울 (A, 12.09±7.16 pg/m3), 서산 (B, 9.21±4.81 pg/m3), 제주 (C, 6.25±2.56 pg/m3)의 순으로 감소하였고, 조사된 지점에서 α-HCH가 60-80% 비율로 가장 높게 검출되었으며, technical HCH의 구성 특성과 유사하였다. 두 이성질체의 농도비 (α-HCH/γ-HCH)는 2.6-4.5로 서울, 서산, 제주에서 각각 2.6±0.8, 4.5±1.2, 4.1±1.0의 값으로 나타났다. 일반적으로 알려진 technical HCHs의 값 (α-HCH/γ-HCH = 4-5)과 비교해보면, 농업 · 중공업 복합지역인 서산과 배경지역인 제주에서는 유사한 수준으로 확인된 반면, 도시지역인 서울에서는 훨씬 낮은 값을 보였다. 이러한 서울의 낮은 technical HCHs의 값은 상대적으로 최근까지 사용된 오염원으로부터의 lindane 유입에 의한 영향이 크게 나타났음을 의미하며, 그리고/또는 최근 사용된 technical HCHs에 의한 영향은 미비한 수준임을 추측할 수 있다[33].

Atmospheric concentrations of HCHs at the study sites in South Korea (Inset: Compositional proportions of HCHs).
3.1.1.3. CHLs, EnSFs
클로르데인 (chlordanes, CHLs)은 유기염소계 살충제로 농작물, 잔디와 정원, 건물 해충 방제 등 다양한 분야에 사용되었다[34]. Technical CHLs은 주성분인 trans-chlordane (TC, 13%), cis-chlordane (CC, 11%), trans-nonachlor (TN, 5%), heptachlor (5%)와 기타 이성질체들로 이루어진 혼합물이다. 1948년 처음 생산되어 1980년대 말까지 전 세계적으로 광범위하게 사용되었으며[35], 2004년에 스톡홀름협약 부속서 A에 특정면제 없이 등재되었다[36].
국내 환경대기 중 CHLs의 평균 농도 분포와 이성질체 패턴을 Fig. 6(a)에 나타내었다. CHLs의 평균 농도는 3.32±5.78 pg/m3 (ΣHUPs의 1.8% 수준)로, 제주 (C, 4.98±8.51 pg/m3), 서산 (B, 3.01±4.34 pg/m3), 서울 (A, 1.94±1.87 pg/m3)의 순으로 감소하였다. 두 이성질체의 농도비 (TC/CC)는 0.8-1.0으로 제주, 서산, 서울에서 각각 0.8±0.5, 1.0±0.5, 1.0±0.5의 값을 보였고, 모든 지역에서 technical CHL의 값 (TC/CC = 1.26-1.35)에 비해 다소 낮았는데, 이처럼 농도비가 < 1의 값을 보이는 것은 과거 사용 및 TC의 감소와 같이 오래된 오염원에 영향을 의미한다[37].
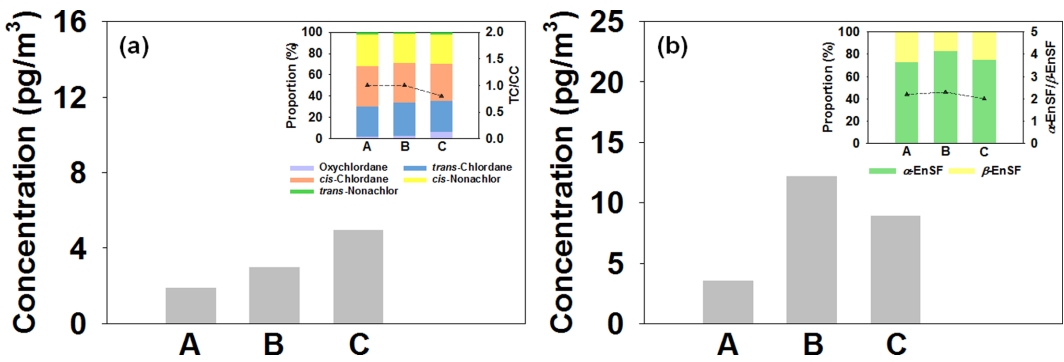
Atmospheric concentrations of (a) CHLs and (b) EnSFs at the study sites in South Korea (Inset: Compositional proportions of CHLs and EnSFs).
엔도설판 (endosulfan, EnSFs)은 사이클로다이엔 (cyclo-diene) 살충제 중 하나로, 다양한 종류의 곤충을 방제하고 목재를 보존하기 위해 전세계적으로 광범위하게 사용되었다[38]. Technical EnSFs은 두 이성질체인 α-endosulfan 과 β-endosulfan이 혼합된 물질로 보통 2:1에서 7:3의 비율로 존재하며, 두 이성질체는 서로 전환될 수 있으나 일반적으로는 열역학적 안정성이 높은 α-endosulfan이 우세하게 존재하는 것으로 보고되었다[39]. EnSFs은 2011년에 스톡홀름협약 부속서 A에 특정면제 (작물 해충제)를 포함하여 등재되었으나, 2019년까지 중국과 과테말라에서 사용되었음이 보고되었다[40].
국내 환경대기 중 EnSFs의 평균 농도 분포와 이성질체 패턴을 Fig. 6(b)에 나타내었다. EnSFs의 평균 농도는 8.31±10.51 pg/m3 (ΣHUPs의 4.5% 수준)로 서산 (B, 12.36±13.89 pg/m3), 제주 (C, 9.12±9.40 pg/m3), 서울 (A, 3.66±4.11 pg/m3)의 순으로 감소하였으며, 특히 농업 · 중공업 복합지역인 서산과 배경지역인 제주에서 다소 높은 경향을 보였다. 두 이성질체의 농도비 (α-EnSF/β-EnSF)는 2.0-2.3으로 서산, 제주, 서울에서 각각 2.3±1.2, 2.0± 0.9, 2.2±1.1의 값을 보였고, 모든 지역에서 일반적인 technical EnSF의 값 (α-EnSF/β-EnSF= ~2.3)과 유사하였다[41].
조사된 두 물질의 이성질체 패턴 비교를 통해, 국내 환경대기 중 CHLs과 EnSFs의 주 오염원은 최근 사용으로 인한 유입 영향보다는 과거에 사용된 물질의 영향으로 판단된다.
3.1.1.4. DDTs, Dicofols
디디티 (dichlorodiphenyltrichloroethanes, DDTs)는 가장 널리 알려진 유기염소계 살충제로 1940년대에 사용되어 1970년대 초에 많은 국가에서 금지되기 전까지 광범위하게 사용되었다[42]. Technical DDTs는 주 구성성분인 p,p’-DDT (65-85%) 및 o,p’-DDT (15-21%)와 기타 이성질체들이 포함된 혼합물로[43] 2004년 스톡홀름협약 부속서 B에 등재되었으나, 특정면제 (dicofol 생산)를 조건으로 2009년까지 중국과 인도에서 사용되었다[44].
국내 환경대기 중 DDTs의 평균 농도 분포와 이성질체 패턴을 Fig. 7(a)에 나타내었다. DDTs의 평균 농도는 3.76±3.87 pg/m3 (ΣHUPs의 2.0% 수준)로 서울 (A, 5.81± 4.40 pg/m3), 서산 (B, 2.85±2.41 pg/m3), 제주 (C, 2.58±3.59 pg/m3)의 순으로 감소하였으며, 도시지역인 서울에서 상대적으로 높은 분포를 보였다. DDTs 이성질체의 농도비 [(DDTs/DDEs+DDDs)]는 0.22-0.50으로 서울, 서산, 제주에서 각각 0.50±0.25, 0.27±0.27, 0.22±0.28이었으며, 모든 지역에서 < 1의 값으로 나타났다. 이는 DDTs에 비해 DDTs의 분해산물 (DDE 및 DDD)의 비중이 높은 것으로 국내 환경대기 중 DDTs의 주 오염원은 과거에 사용된 물질의 영향으로서 최근 사용에 의한 유입 영향이 없는 것으로 예상된다[45].
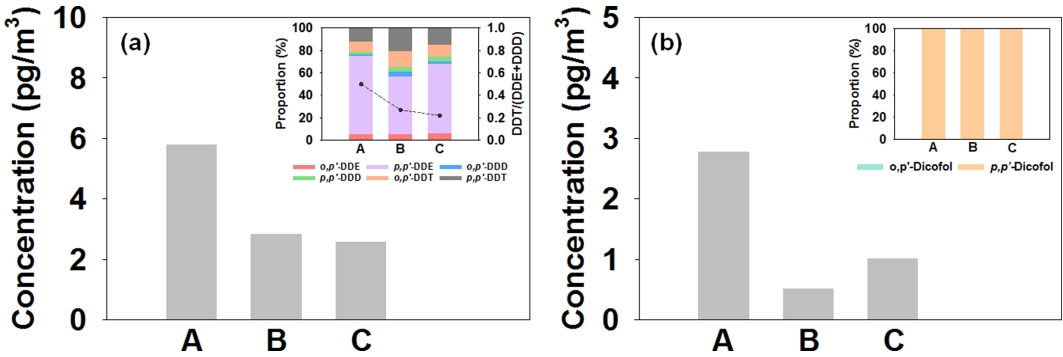
Atmospheric concentrations of (a) DDTs and (b) Dicofols at the study sites in South Korea (Inset: Compositional proportions of DDTs and Dicofols).
디코폴 (dicofol)은 1950년대 중반부터 식품, 사료 및 상품작물 등 다양한 분야에 진드기의 유기염소계 살비제로 사용되다가 2010년대부터 점차적으로 많은 국가에서 금지되기 시작했다[46]. Technical dicofols은 주로 technical DDTs의 염소화 및 가수분해 반응을 이용한 공정에서 합성됨에 따라 두 이성질체인 o,p’-dicofol (15-20%)과 p,p’-dicofol (80-85%)로 대부분 구성되어 있으며, 이와 함께 DDTs 및 관련 화합물을 불순물로써 함유하고 있다[47]. Dicofols은 HUPs 중 가장 최근인 2019년 스톡홀름협약 부속서 A에 특정면제 없이 등재되었다[48].
국내 환경대기 중 Dicofols의 평균 농도 분포와 이성질체 패턴을 Fig. 7(b)에 나타내었다. Dicofols의 평균 농도는 1.46±3.44 pg/m3 (ΣHUPs의 0.8% 수준)로 서울 (A, 2.79±4.53 pg/m3), 제주 (C, 1.02±2.68 pg/m3), 서산 (B, 0.53±2.12 pg/m3)의 순으로 감소하였으며 DDTs와 마찬가지로 도시지역인 서울에서 상대적으로 높은 경향을 보였다.
Technical dicofols과 technical DDTs는 공통으로 o,p’-DDT와 p,p’-DDT를 포함하고 있다. 그러나, p,p’-DDT가 p,p’-dicofol로 전환되는 효율이 o,p’-DDT의 경우 (o,p’-dicofol로의 전환)보다 높아 technical dicofols과 technical DDTs 간의 DDTs 이성질체의 비율 (o,p’-DDT/p,p’-DDT) 차이가 발생하게 되며, 이를 이용하여 DDTs의 주 오염원을 간접적으로 예측할 수 있다 (technical dicofols: 3-7, technical DDTs: 0.2-0.3) [49].
국내 환경대기 중 DDTs 이성질체 농도비와 DDTs 및 Dicofols 이성질체 간의 상대비를 Fig. 8에 각각 나타내었다. DDTs 이성질체 농도비 (o,p’-DDT/p,p’-DDT)는 0.0-1.4로 서울, 제주, 서산에서 각각 0.65±0.27, 0.73±0.47, 0.57±0.40이었으며, 모든 지역에서 technical dicofols에 비해 훨씬 낮았으나 technical DDTs에 비해서는 다소 높은 경향으로 나타났다. 특히, Dicofols이 차지하는 비율은 전체 Σ(DDTs+Dicofols) 중 9.8% 수준으로 DDTs (90.2%)에 비해 매우 낮았다. 이러한 결과는 국내 환경대기 중 DDTs의 주 오염원으로써 Dicofols보다는 DDTs에 의한 영향이 크게 작용하고 있음을 시사한다[50]. 또한, 낮은 농도 수준 (DDTs의 < 50%)과 및 적은 검출 빈도의 Dicofols 모니터링 분석 결과에서도, Dicofols이 국내 환경대기에 미치는 영향이 상대적으로 적음을 나타내고 있었다.
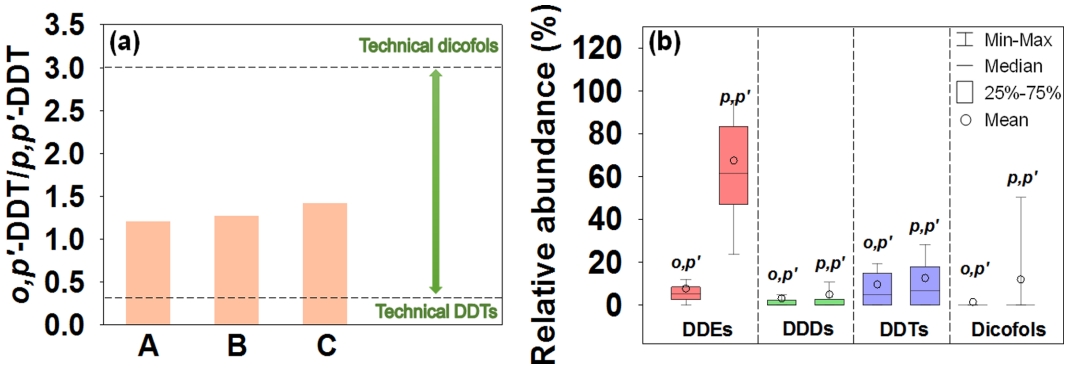
(a) Isomeric ratios of DDTs and (b) relative abundances of isomers of DDTs and Dicofols in the atmosphere of South Korea.
3.1.2. CUPs 농도 분포
7종의 CUPs (alachlor, atrazine, bifenthrin, carbaryl, chlorpyrifos, permethrin, trifluralin)는 HUPs를 대체하여 최근 사용된 농약 (current use pesticides, CUPs)으로, 최근까지도 전 세계 곳곳에서 공식적으로 사용되고 있는 미규제 농약류이다. 서론에서 언급한 바와 같이, 환경 내 잔류성이 낮도록 개발되었음에도 HUPs와 마찬가지로 환경 대기 중에서 빈번하게 검출되고 있다[51-52].
각 지역에서 측정된 ΣCUPs의 평균 농도 분포를 Fig. 9(a)에 나타내었다. 서울(도시지역, A), 서산(농업 · 중공업 복합지역, B), 제주 (배경지역, C)에서의 ΣCUPs 평균 농도는 각각 259.26±319.41 pg/m3, 1,839.64±2,803.82 pg/m3, 1,580.40±3,398.05 pg/m3로 서산, 제주, 서울의 순으로 감소하였으며, 특히 농업 · 중공업 복합지역인 서산과 배경지역인 제주에서 고농도 분포 특성이 확인되었다. 각 지역에서의 ΣCUPs 조성 분포를 Fig. 9(b)에 나타내었다. 모든 지역에서 alachlor, chlorpyrifos가 고농도 분포를 보였는데, 이는 ΣCUPs의 77.5-99.8%에 해당하는 수준이었으며, 지역별로 거의 유사한 분포 패턴을 보였다. 다만, 다른 지역과 달리 도시지역인 서울에서는 permethrin이 다소 높은 비율 (18.2%)로 검출되는 특성을 나타냈다.
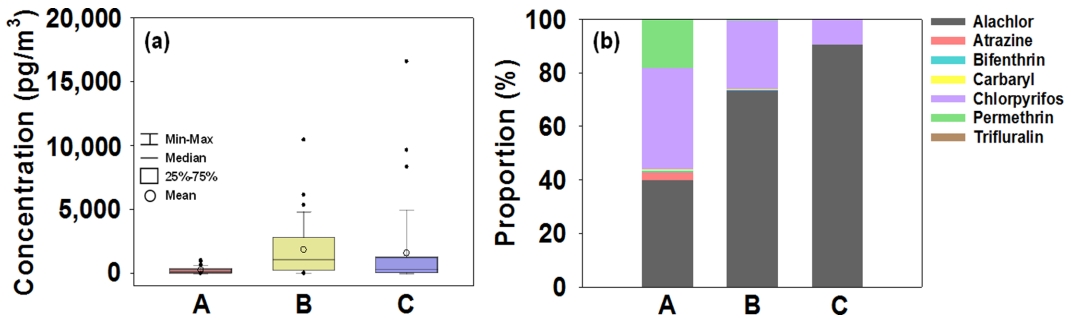
(a) Atmospheric concentrations and (b) compositional proportions of ∑CUPs at the study sites in South Korea.
3.1.2.1. Alachlor, Chlorpyrifos, Carbaryl
알라클로르 (alachlor)는 클로로아세트아닐라이드 (chloro-acetanilide)계 농약으로, 주로 한해살이풀 및 넓은 잎 잡초 제거를 위한 제초제 용도로 광범위하게 사용되었다[53]. 국내에서는 2007년부터 2011년까지 약 485.7톤에 달하는 양이 사용되었으며, 이는 전체 CUPs 사용량의 2.2%에 해당하는 것으로 확인되었다[54]. 현재 국내에서는 감자, 고추, 딸기 등의 다양한 농작물 재배를 위한 한해살이풀 제초제로 사용되고 있다[55].
국내 환경대기 중 alachlor의 평균 농도를 Fig. 10(a)에 나타내었다. Alachlor의 평균 농도는 957.72±2,071.54 pg/m3 (ΣCUPs의 78.5% 수준)로 제주 (C, 1,428.31±3,131.02 pg/m3), 서산 (B, 1,352.34±1,375.59 pg/m3), 서울 (A, 103.48 ±95.13 pg/m3)의 순으로 감소하였다.
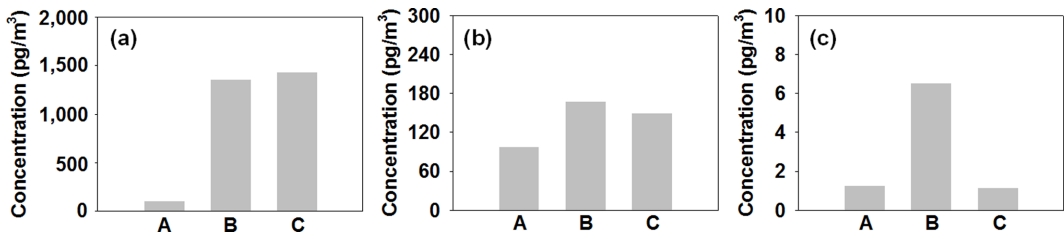
Atmospheric concentrations of (a) alachlor, (b) chlorpyrifos, and (c) carbaryl at the study sites in South Korea.
클로르피리포스 (chlorpyrifos)는 유기인 (organophos-phours)계 농약으로 곤충, 벌레와 같은 해충의 방제를 목적으로 농업 및 주거 분야에서 주로 사용되었다. 이러한 유용성에도 불구하고, 인체 및 환경에 대한 유해성이 확인됨에 따라 최근에는 스톡홀름협약 부속서 A 등재 후보 물질로 검토되고 있다[56]. 국내에서는 2007년부터 2011년까지 약 106.4톤에 달하는 양이 사용된 것으로 추정되며[54] 현재 ‘농약관리법 (agricultural chemicals regulation law)’ 에 따라 2021년부로 농약으로의 등록이 취소되어 국내에서의 사용 또한 금지되었다[57].
국내 환경대기 중 chlorpyrifos의 평균 농도를 Fig. 10(b)에 나타내었다. Chlorpyrifos의 평균 농도는 236.09±810.15 pg/m3 (ΣCUPs의 19.3% 수준)로 서산 (B, 468.05±1,355.45 pg/m3), 제주 (C, 149.26±254.64 pg/m3), 서울 (A, 97.41±143.71 pg/m3)의 순으로 감소하였다.
카바릴 (carbaryl)은 카바메이트 (carbamate)계 농약으로 넓은 범주의 곤충을 효과적으로 억제하는 살충제로 농업 분야에서 널리 사용되었다. 국내에서는 2007년부터 2011년까지 약 31.4톤에 달하는 양이 사용된 것으로 추정된다[58]. Carbaryl은 현재 국내에서 합제 (수화제의 형태)로 담배나방, 뿌리응애 등의 다양한 해충 제거를 위한 살충제로 사용되고 있다[59].
국내 환경대기 중 carbaryl의 평균 농도를 Fig. 10(c)에 나타내었다. Carbaryl의 평균 농도는 2.95±18.00 pg/m3 (ΣCUPs의 0.2% 수준)로 서산 (B, 6.51±30.34 pg/m3), 서울 (A, 1.28±5.29 pg/m3), 제주 (C, 1.15±4.73 pg/m3)의 순으로 감소하였다.
Alachlor, chlorpyrifos 및 carbaryl은 공통적으로, 특히 농업 · 중공업 복합지역인 서산에서 상대적으로 높은 분포 특성을 보였는데, 이는 국내에서 제초제 또는 살충제로써 농업 분야에 주로 사용된 결과가 반영된 것으로 판단된다.
3.1.2.2. Atrazine, Permethrin
아트라진 (atrazine)은 합성 트리아진 (triazine)계 농약의 일종으로 전 세계적으로 수수, 견과류 및 옥수수 등 작물의 잡초를 방제하기 위한 사용되었으나[60], 국내에서는 농약으로 사용된 이력이 없는 것으로 보고되었다[54].
국내 환경대기 중 atrazine의 평균 농도를 Fig. 11(a)에 나타내었다. Atrazine의 평균 농도는 3.80±14.79 pg/m3 (ΣCUPs의 0.3% 수준)로 서울 (A, 7.65±20.06 pg/m3), 서산 (B, 2.44±14.24 pg/m3), 제주 (C, 1.28±5.29 pg/m3)의 순으로 감소하였다.
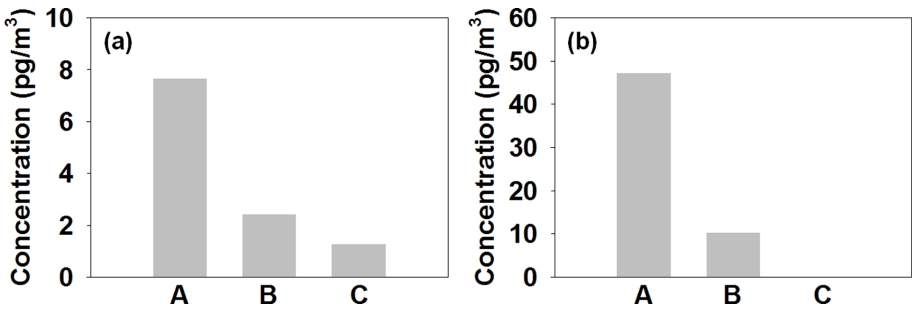
Atmospheric concentrations of (a) atrazine and (b) permethrin at the study sites in South Korea.
퍼메트린 (permethrin)은 피레드로이드 (pyrethroid)계 농약으로 농작물 및 모기, 바퀴벌레와 같은 위생 해충 관리를 위한 살충제로써 전세계적으로 광범위하게 사용되었으나[61], atrazine과 마찬가지로 국내에서는 농약으로 사용된 이력이 없는 것으로 보고되었다[54].
국내 환경대기 중 permethrin의 평균 농도를 Fig. 11(b)에 나타내었다. Permethrin의 평균 농도는 19.25±35.58 pg/m3 (ΣCUPs의 1.6% 수준)로 서울 (A, 47.20±41.96 pg/m3), 서산 (B, 10.30±28.20 pg/m3), 제주 (C, N.D. pg/m3) 지역의 순으로 감소하였다.
Atrazine과 pertmethrin은 국내에서 사용되지 않은 농약임에도 불구하고 환경대기 중 검출된 농도가 일부 CUPs (bifenthrin, carbaryl, trifluralin) 물질과 유사하거나 상대적으로 높은 분포 수준을 보였다. 이러한 결과는 atrazine 과 permethrin이 국내에서 살생물 물질로, 제품, 목재 및 건축자재용 보존제 등 다양한 분야에서 현재까지도 사용되고 있기 때문으로 판단된다 (2018년 기준, 국내 연간 화학물질 · 제품 제조업 사용량: atrazine 7.6 kg, permethrin 337톤) [62-63].
3.1.2.3. Bifenthrin, Trifluralin
비펜트린 (bifenthrin)은 3세대 합성 피레드로이드 (pyrethroid)계 농약으로 큰 살충효과로 인해 농업, 수의학, 조경 등 다양한 분야에서 살충제로 사용되었다[64]. 국내에서는 2007년부터 2011년까지 약 4.3톤에 달하는 양이 사용된 것으로 추정된다[52]. Bifenthrin은 현재 국내에서 청동방아벌레, 거세미나방 등의 방제를 위한 살충제로 사용되고 있다[65].
국내 환경대기 중 bifenthrin의 평균 농도를 Fig. 12(a)에 나타내었다. Bifenthrin의 평균 농도는 0.72±6.20 pg/m3 (ΣCUPs의 0.1% 수준)로 서울 (A, 1.75±10.34 pg/m3), 제주 (C, 0.40±2.37 pg/m3), 서산 (B, N.D. pg/m3)의 순으로 감소하였다.
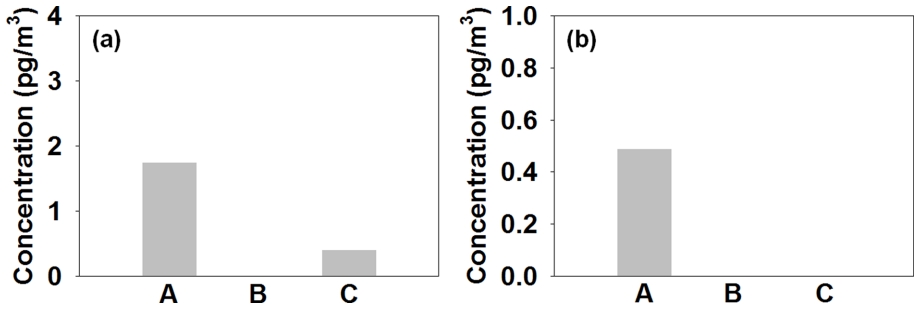
Atmospheric concentrations of (a) bifenthrin and (b) trifluralin at the study sites in South Korea.
트리플루랄린 (trifluralin)은 합성 다이나이트로아닐린 (dinitroaniline)계 농약의 일종으로 잡초 발아 전에 사용하는 제초제로써 광범위하게 사용되었다[66]. 국내에서는 2007년부터 2011년까지 약 12.1톤에 해당하는 양이 사용된 것으로 추정된다[54]. Trifluralin은 현재 국내에서 보리, 배추 등의 농작물 재배를 위한 한해살이풀 제초제로 사용되고 있다[67].
국내 환경대기 중 trifluralin의 평균 농도를 Fig. 12(b)에 나타내었다. Trifluralin의 평균 농도는 0.17±1.71 pg/m3 (ΣCUPs의 < 0.1% 수준)로 서울에서만 일부 검출되었고, 서산과 제주에서는 검출되지 않았다.
Bifenthrin과 trifluralin은 조사된 지점들에서 상당히 낮은 분포 수준을 보였으며, 지역 간의 유의성은 확인되지 않았다.
3.2. 계절별 농도 분포 특성
국내 환경대기 중 계절 변화에 따른 HUPs 및 CUPs의 농도 분포 특성을 Fig. 13에 나타내었다. HUPs 중 HCHs, CHLs, EnSFs, DDTs 및 dicofols은 여름에 가장 높고 겨울에 가장 낮은 경향을 보이며 계절이 변함에 따라 명확한 분포 패턴의 특성을 나타냈다 (Fig. 13(a); HCHs, r = 0.54, p < 0.01; CHLs, r = 0.53, p < 0.01; EnSFs, r = 0.58, p < 0.01; DDTs, r = 0.48, p < 0.01; dicofols, r = 0.26, p < 0.01). 이와는 달리, CBs은 가을에 다소 높은 농도 수준을 보였으나, 계절 변화에 대한 유의성이 확인되지는 않았다(r = 0.07, p > 0.05). 이러한 결과는 다양한 산업공정으로부터의 비의도적 배출과 관련된 CBs 오염원의 특징 을 보여준다[68].
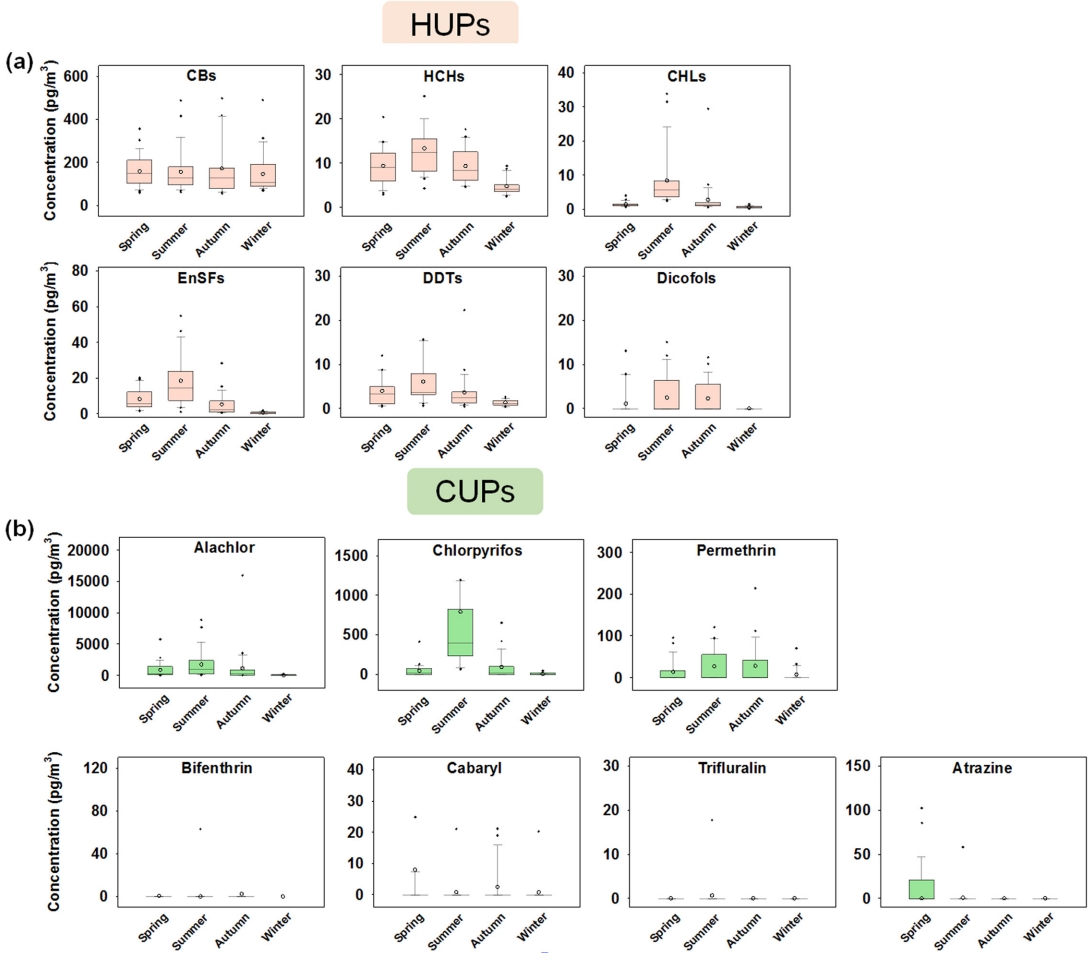
Distributional characteristics in the atmospheric concentrations and temperatures of (a) HUPs and (b) CUPs.
CUPs의 중 alachlor, chlorpyrifos 및 permethrin은 여름에 가장 높고 겨울에 가장 낮은 경향을 보이며, 대부분의 HUPs와 같은 분포 패턴을 보였다 (Fig. 13(b); alachlor, r = 0.34, p < 0.01; chlorpyrifos, r = 0.32, p < 0.01; permethrin, r = 0.23, p < 0.05). 반면에 bifenthrin, carbaryl, trifluralin 및 atrazine의 경우에는 계절 변화에 대한 유의성이 확인되지 않았으며, 이는 이들의 상대적으로 낮은 검출 농도 수준과 적은 검출 빈도 (n < 10)에 의한 영향으로 판단된다 (bifenthrin, r = 0.09, p > 0.05; carbaryl, r = 0.01, p > 0.05; trifluralin, r = 0.12, p > 0.05; atrazine, r = 0.52, p > 0.05).
또한, 본 연구에서 조사된 HUPs 및 CUPs (앞서 언급한 비의도적 배출과 연관된 CBs과 검출 빈도가 낮은 bifenthrin, carbaryl, trifluralin 및 atrazine을 제외)의 계절 변화에 대한 분포 특성이 국내 · 외 선행연구에서 보고된 결과들과 유사한 패턴을 보이는 것을 확인하였으며[69-71], 여름에 농도가 급격하게 증가하는 현상은 기온이 증가함에 따라 토양, 퇴적물, 해양 등의 환경 매체에 축적되어있던 물질이 재휘발 (과거 또는 최근에 사용)되어 대기로 유입되는 현상으로 인해 발생된 것으로 추정된다[72-73].
4. 결 론
본 연구에서는 2021년 1월부터 12월까지 1년간 국내 주요 도시지역 (서울), 농업·중공업 복합지역 (서산), 배경 지역 (제주)에서의 환경대기 중 HUPs와 CUPs의 검출 농도 수준 및 계절 변화에 따른 분포 특성을 조사하였다. HUPs는 국내에서도 완전히 생산 및 사용이 금지되었으나 여전히 대부분의 물질이 환경대기 중에서 검출되었다. 그중에서도, CBs은 ΣHUPs 농도의 최대 86%에 달하는 고농도 수준이 확인되었는데 이러한 특성은 모든 지역에서 동일하게 나타났으며, 그 외 농약류의 경우에는 HCHs 와 EnSFs이 상대적으로 높게 검출되는 경향을 보였다. 현재 국내에서도 사용되고 있는 미규제 농약류인 CUPs 또한 지속적으로 환경대기 중에서 검출되었다. 특히, alachlor와 chlorpyrifos는 ΣCUPs의 최대 99.8%에 달하는 고농도 분포 수준을 보였으며, 국내에서 농약으로 사용된 이력이 없는 atrazine과 permethrin은 일부 CUPs에 비해 상대적으로 높은 수준의 농도 분포를 보이는 것으로 확인되었다.
국내 환경대기 중 HUPs와 CUPs의 농도는 서울과 제주에 비교하여 서산에서 가장 높게 나타났는데, 이는 농업, 산업, 발전소 등 다양한 환경이 복합적으로 밀집된 지역적 특성이 반영된 결과로 추정된다. 또한, HUPs와 CUPs는 여름에는 고농도 분포와 겨울에는 이와 상반되는 저농도 분포 경향을 보이는 계절 변화에 따른 명확한 상관관계가 확인되었다. 이러한 결과는 상대적으로 기온이 높은 여름에 토양, 퇴적물 및 해양 표면에서 물질의 휘발이 빈번하게 발생하게 되고 이로부터 대기로 유입되어 급격한 농도 증가 현상으로 이어지는 것으로 추정된다.
본 연구에서는 국내 환경대기 중 과거에 금지된 농약류와 현재까지도 사용하고 있는 농약류의 농도 조사 및 분포 특성을 평가하였으며, 조사된 물질별 오염원의 기원 및 유입 특성을 통해 향후 이들의 국내 적정 관리방안 마련에 효과적으로 활용될 수 있을 것이다.
Acknowledgements
본 연구는 환경부의 재원으로 국립환경과학원의 지원을 받아 수행하였습니다 (NIER-2020-01-01-023).